
timeless PinkLetters, translated from our Spanish Substack for English-speaking readers.
Obsessed with MRR, Confused about LTV
When metrics become a way to tell a happy story instead of informing real decisions, we lose sight of their true purpose: understanding the business.
In venture capital, there’s a widespread obsession with MRR — Monthly Recurring Revenue. These businesses are easy to analyze and project. If your retention curves are stable, the numbers start to look like a money-printing machine: predictable, tidy, beautiful.
The problem is that “MRR” often gets repeated like a mantra — without pausing to think about what it really means. Strictly speaking, MRR only applies to subscription businesses, where customers commit to paying a fixed amount every month, either via a month-to-month contract or a longer-term agreement.
However, many founders present their revenues as recurring when they really aren’t.
But what truly matters isn’t whether the revenue technically qualifies as MRR — it’s how predictable it is.
For instance, a SaaS company (pure MRR) with erratic churn rates that fluctuate month to month offers no predictability at all. On the other hand, a marketplace where transaction volume per user is stable, and retention is strong, provides a far clearer view of future revenue.
In this PinkLetter, we’ll review different ways to analyze revenue repetition and calculate the famous Lifetime Value (LTV) — that magical number many founders compute using formulas they barely understand. We’ll explore real examples and some of my favorite visuals: retention and revenue-age curves.
Case Study: B2B Marketplace
Let’s analyze TeContratoYa, a B2B marketplace that launched in mid-2022, with data available through October 2024. We’ll review its historical performance to estimate LTV. Revenues aren’t “recurring,” there’s no MRR — but our goal is to understand how much repetition exists and whether it’s predictable enough to build reliable projections.
Revenue Analysis
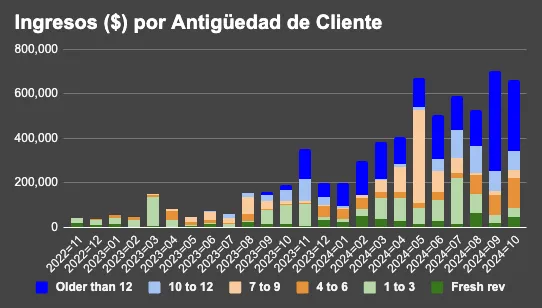
In the bar chart, the black series shows revenue generated by first-time (new) customers in each period, while the green represents revenue from existing ones. At first glance, the numbers look great — but perhaps TeContratoYa is spending heavily on acquisition while those customers quickly reduce their activity over time.

To go deeper, we visualize the same data by customer tenure — understanding whether revenue sticks over time or depends mostly on acquisition. In the following chart, “fresh revenue” represents newly onboarded users, while the “1 to 3” series shows users acquired in the previous three periods. We can see that customers older than one year (the blue series) contribute significantly.
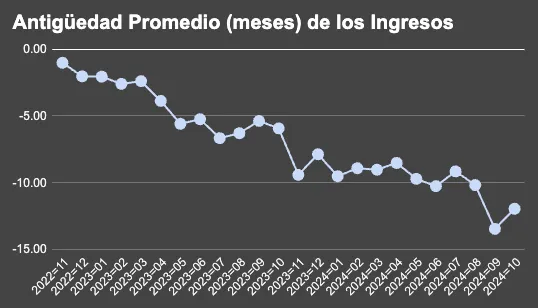
A useful way to summarize this is to compute the average revenue age — a weighted average of revenue and customer tenure. This is similar to how finance teams analyze collections performance.
Simplified LTV Model
Most common LTV formulas are overly simplistic and rest on shaky assumptions. For example, in this Amplitude blog post, we find the well-known equation:

This formula estimates customer value based on revenue. But if we want to compare it against our Customer Acquisition Cost (CAC), we should use net margin — revenues minus the incremental costs of serving that customer.
The key is to understand what the formula is actually calculating — something rarely explained. That simple expression is the infinite sum of a geometric series. Math aside, it assumes three critical things:
1- Constant retention: Churn (or its inverse, retention) remains stable month to month. That’s rarely true — many products churn heavily early on and then stabilize. Averaging that curve can distort results.
2- Constant unit economics: Monthly revenue per customer remains unchanged. In models with upsell, downsell, or usage-based pricing, this assumption breaks down.
3- Infinite permanence: Some customers stay forever. In reality, they don’t — everyone leaves eventually.
The third assumption isn’t too relevant since after ~20 periods, the tail contribution is minimal. In this article, we’ll focus mainly on the first assumption.
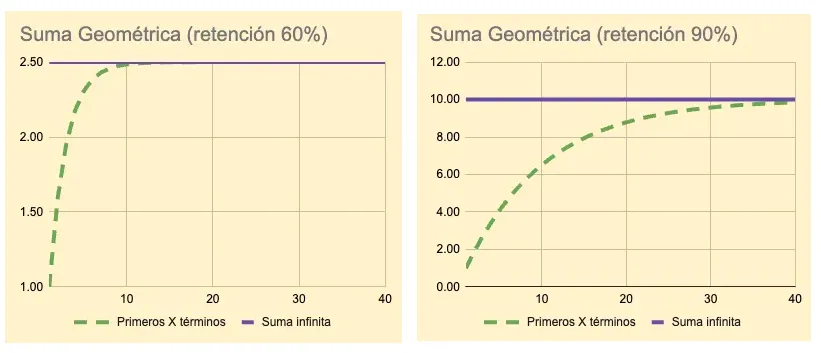
A more intuitive way to see the formula is as the product of initial revenue and an amplification factor.

This factor represents the multiple of lifetime revenue per customer — assuming constant churn and no behavioral changes. As shown below, with 60% retention (40% churn), the multiplier is 2.5x and captures most value in 10 periods. With 90% retention, the multiplier jumps to 10x, requiring ~30 periods to capture nearly all the value.
👉 You can explore these charts and more in this interactive LTV spreadsheet, where you can tweak inputs (highlighted in yellow and blue) to see how they affect results.
Estimating Churn
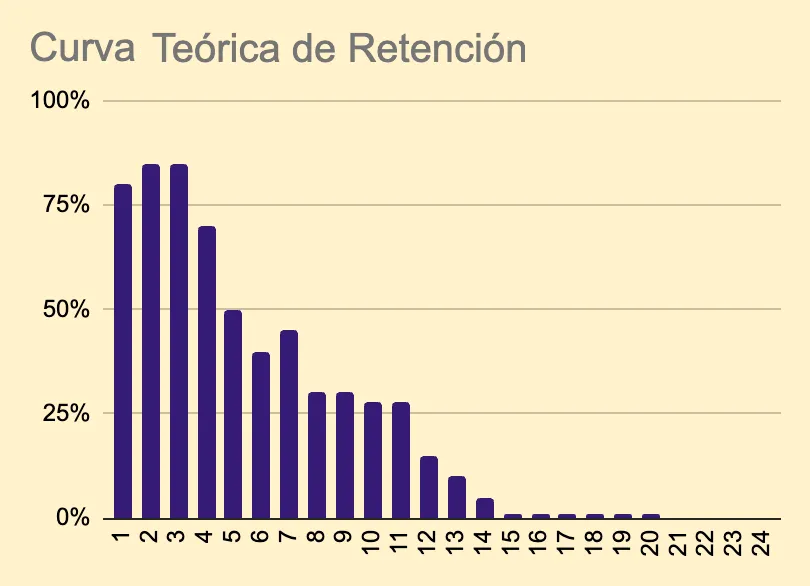
In the interactive spreadsheet, we simulated a dynamic dataset using parameters and random functions, built around a perfect theoretical curve with added noise — ensuring that overall retention always declines over time.
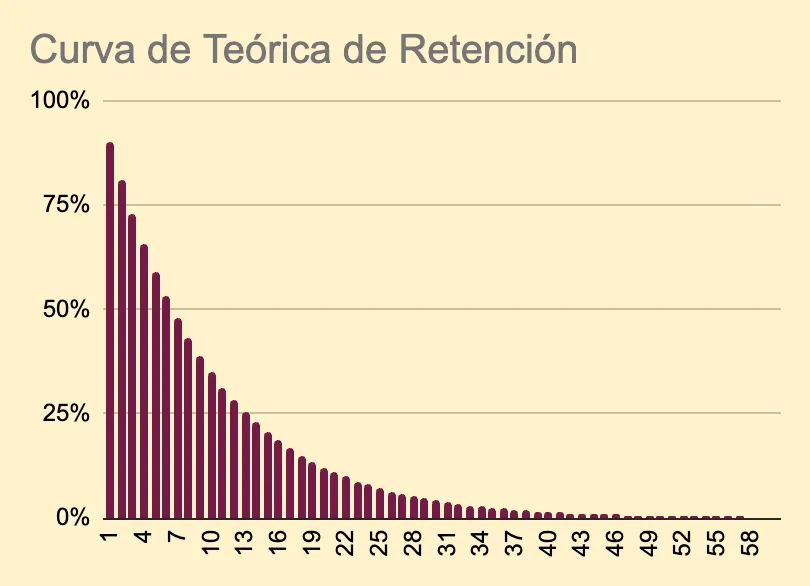
We simulated 12 cohorts representing TeContratoYa’s operational data. The theoretical customer behavior curve is, of course, unknown to the startup’s founders. The Head of Growth has calculated retention for all 12 cohorts — which look like this:
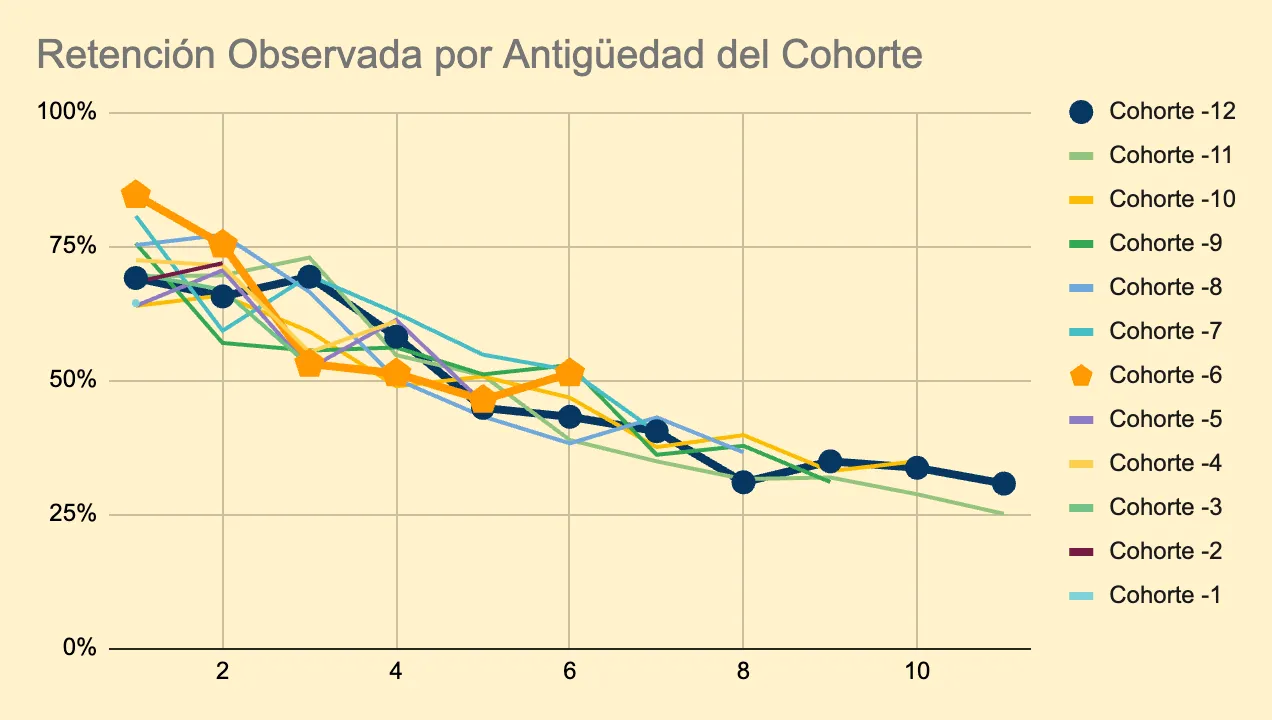
Here comes the dilemma: Which churn rate should we use for LTV estimation?
Older cohorts provide longer retention histories but may reflect outdated product conditions. Newer cohorts capture current performance but offer fewer months of data.
In the chart, cohort -6 (customers acquired six months ago) provides retention data up to month six, while cohort -12 extends further. Six-month retention for cohort -6 is ~52%, versus ~43% for cohort -12. Which one should we pick?
By averaging across cohorts, we can combine short- and long-term effects, though we’ll always have more short-term data. In real scenarios, outliers must be filtered to avoid bias.

Then we extrapolate the incomplete curve — beyond 24 months is rarely meaningful — adopting reasonable assumptions. The conservative stance is to drop retention to zero after month 12, but real patterns are smoother, so hand-drawing a continuation often yields better estimates.
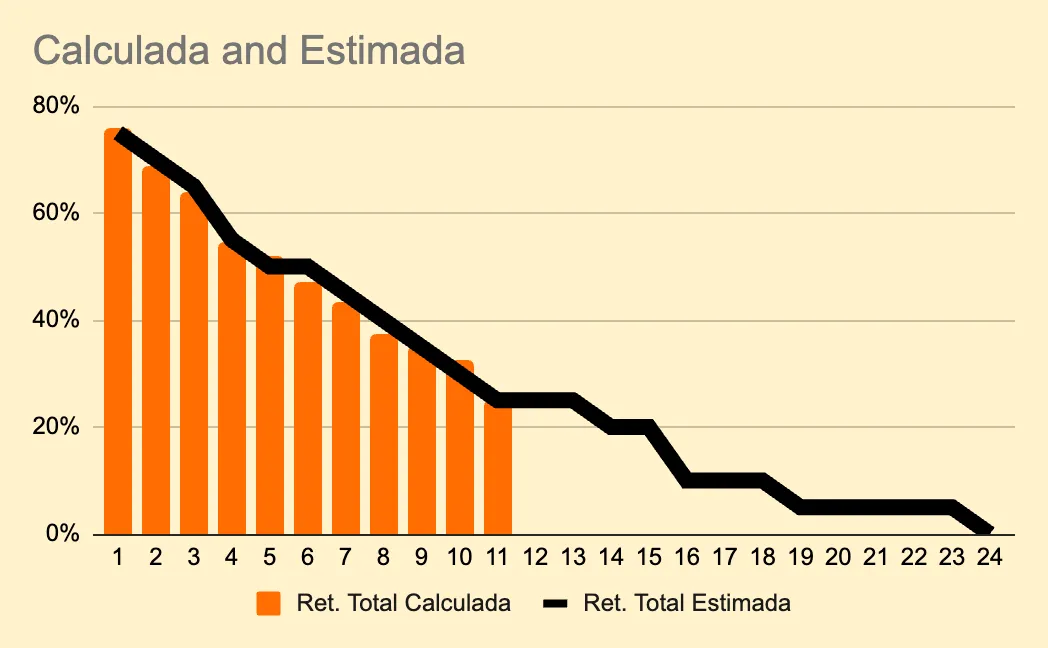
Once we have the cumulative retention curve, LTV = (sum of retention over 24 periods) × initial period revenue.
In the simulation, we computed LTV using both the geometric-series formula and the estimated retention curve. As shown, churn varies dramatically per period, yielding different LTV results.
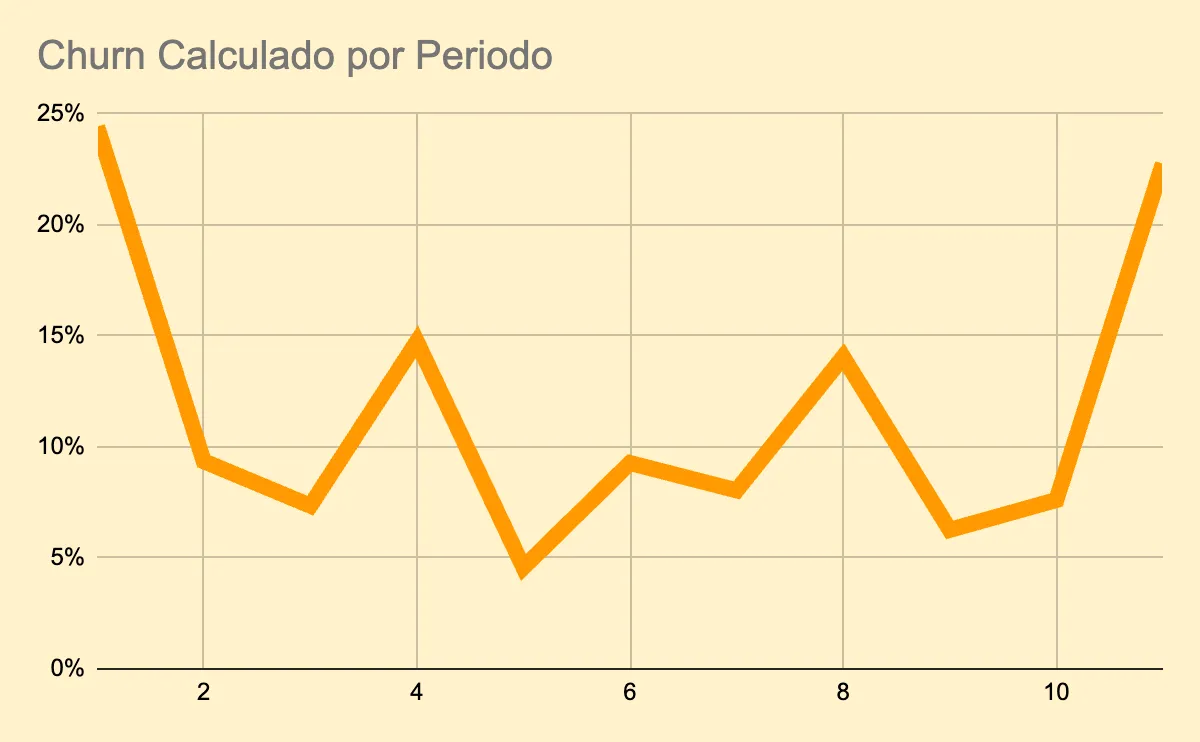
In this case, average churn is ~12%, close to the theoretical 10% (though TeContratoYa doesn’t know it). With $10 ARPU, $10 / 12% = $86 LTV. The true value, based on the 10% curve, is $100. Had we used 5% churn, the estimate doubles to $200 — showing how sensitive this method is.
That’s why I prefer working with the full retention curve — summing the actual observed values rather than assuming constant churn.
A More Realistic Scenario
What if churn isn’t constant period to period?
Using a more irregular curve, the total-retention method yields $66 versus $88 for the simple average-churn method. The real LTV is $71 — meaning the total-retention approach underestimates by 7%, while the simple method overestimates by 24%. A gap that large can drive catastrophic CAC decisions.
Closing Thoughts
The goal of this article is to encourage reflection on how we calculate and interpret metrics. Sometimes, simple methods suffice — but only if we understand their assumptions. Metrics should inform decisions, not decorate decks.
Especially with CAC, resist the temptation to “adjust it” to make your fundraising narrative look good. It’s a core KPI that should guide daily operations — how much to invest in marketing, when to scale, which channels to prioritize.
The same goes for LTV: it’s not a fixed or universal number. It changes over time, across cohorts, and between segments. SMB behavior isn’t Enterprise behavior. Industry retention patterns don’t transfer perfectly.
Whatever method you choose, don’t automate your thinking. Question your logic, understand your assumptions, and avoid getting lost in formulas or efficiency myths.
Metrics aren’t the truth — but if used with intellectual honesty and a deep understanding of your business, they can bring you closer to it.